Microsoft Power BI tops the
poll
Microsoft Power BI tops the poll
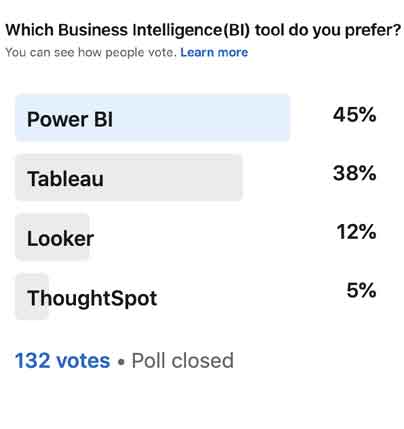
Businesses have a lot of excellent options because of the variety of BI Tools on the market. Deciding on which BI tool to select to receive the most value for their particular needs might be difficult given the abundance of options. Lyftrondata recently launched a poll to gain additional insight into the decision-making process. The poll asked organizations to select one of four BI Tools and describe which one they would use to obtain the greatest actionable insights.
At the top, Power BI received 45% of the votes. Tableau came in second place with 38% of the vote, followed by Looker in third place with 12% and Thoughtspot in fourth place with 5%. Now let's quickly review how Lyftrondata uses BI Tools to streamline corporate analytics and data management.
What is Business Intelligence (BI)?
A group of software services, applications, and connectors called Power BI come together to transform your disparate data sources into cohesive, interactive, and visually stunning insights. Your data might be stored in a hybrid data warehouse that is both on-premises and in the cloud, or it could be an Excel spreadsheet. With Power BI, you can quickly establish a connection to your data sources, display your data to identify what's significant and share your visualizations with anybody you choose.
LET’S GET PERSONAL: SEE LYFTRONDATA ON YOUR DATA IN A LIVE DEMO
Schedule a free, no-strings-attached demo to discover how Lyftrondata can radically simplify data lake ETL in your organization.


Why is Power BI unique?
Microsoft offers a business analytics service called Power BI. With its self-service business intelligence features and interactive visualizations, end users can generate reports and dashboards independently of database administrators or information technology personnel.
Companies may enter volumes of data into Power BI that would be difficult for many other platforms to handle.
With the use of integrated machine learning capabilities, users may identify important trends in data and create well-informed forecasts.
Strong templates can be used to visualize data so that organizations can better understand their data.
Because Power BI is cloud-based, customers have access to cutting-edge intelligence features and robust, frequently updated algorithms.
Users can construct dashboards with powerful customization features to easily obtain the data they require.
KPI alerts allow consumers to be informed about critical metrics and data.
Compared to complicated spreadsheets, Power BI is significantly more user-friendly and straightforward to use because of its intuitive UI.
The platform is compatible with non-Microsoft products such as Spark, Hadoop, Google Analytics, SAP, Salesforce, and MailChimp, in addition to other well-known business management tools like Dynamics 365, Office 365, and SharePoint.
Power BI offers fine-grained limits on accessibility both internally and externally, ensuring the security of data.
Describe Lyftrondata
A cutting-edge "No-Code/Low-Code" agile data delivery platform, Lyftrondata enables users to design and oversee all of their data workloads on a single platform. With ANSI SQL, BI, and ML tools, it can be quickly and simply examined. For Agile Business Intelligence, it offers self-service data preparation, data virtualization, and logical data warehousing. Below is a summary of what Lyftrondata does.
Key Highlights:
Easily links over 100 different kinds of data sources.
Combining data instantly without needing an expensive, time-consuming ETL to develop and run.
Combines the data acceleration and quality features of a typical data warehouse with the agility of instantaneous, real-time analytics from self-service BI tools like Power BI.
Reduces reliance on IT departments and encourages cooperation amongst BI users in the field of data management.
Utilizes the top Big-data SQL engines, such as Apache Spark, to get optimal performance.
How do Power BI and Lyftrondata interact?
Lyftrondata uses in-memory analytics and the potent Apache Spark Big Data engine to function as a query accelerator and speed up the Power BI dashboard. It uses pre-aggregated copies to rewrite Power BI queries seamlessly. Lyftrondata combines materialized views with pre-aggregated data with Apache Spark for in-memory analysis. An SQL Server can be connected to by a SaaS version of Power BI, despite the limited number of supported connectors. As a data layer for Power BI, Lyftrondata mimics SQL Server and may be deployed on-site or in the cloud.
Any Lyftrondata data source can be converted into an SQL query that Power BI's Direct Query feature allows you to attach straight to.
Lyftrondata is a SQL Server instance that Power BI recognizes as a Microsoft SQL Server simulator. Lyftrondata transforms Transact SQL to over 100 data sources, and Power BI can connect to it using the normal Microsoft SQL Server connector. The development will be made simpler because all dashboards will use the same data source.


Discover how actionable insights are being provided to Power BI users by Lyftrondata
What is Tableau?
Data may be seen and understood with the aid of Tableau Software. Tableau is a business intelligence tool that offers a completely new way to connect, display, and communicate data from PC to iPad in a fluid and fast manner. Without knowing programming, create, publish, and share dashboards with partners, customers, and coworkers.
One of the BI industry's fastest-growing data visualization solutions is Tableau Software. It is an excellent option for converting an unprocessed data collection into a comprehensible format without the need for any technical expertise or coding experience.
Tableau is widely used due to how quickly and easily data can be evaluated. Additionally, worksheets and dashboards are generated from visualizations.
With Tableau, users can build dashboards that offer insights that can be used to advance their business.
When Tableau products are set up with the appropriate underlying operating system and hardware, they always function in virtualized settings.
Tableau is a tool for unlimited visual analytics data exploration.
How does Tableau and Lyftrondata interact?
With Lyftrondata, you can import data from any source into Tableau and perform instantaneous analysis on it. Prepare yourself for a hassle-free, low-maintenance data load. Lyftrondata connects you to well-known business intelligence (BI) products like Tableau and accurately arranges data into query tables that are simple to view and understand. With Lyftrondata's easy-to-use point-and-click interface, you can quickly set up a pipeline while it takes care of all back-end activities. This gives you more time to add value and improve other operational duties. Your staff, from analysts to executives, will have instant access to real-time data insights in just a few seconds, providing them with precise triggers to accelerate the expansion of your company and increase revenues.
Are you looking to unleash the full potential of Tableau? Look no further than Lyftrondata! Discover how they're revolutionizing the way Tableau users access and analyze data, giving you the power to turn insights into action. Join the ranks of successful businesses already benefiting from Lyftrondata's cutting-edge technology today!

Are you unsure about the best option for setting up your data infrastructure?