4 Simple Steps for Migrating to
Data Wrapper with zero coding


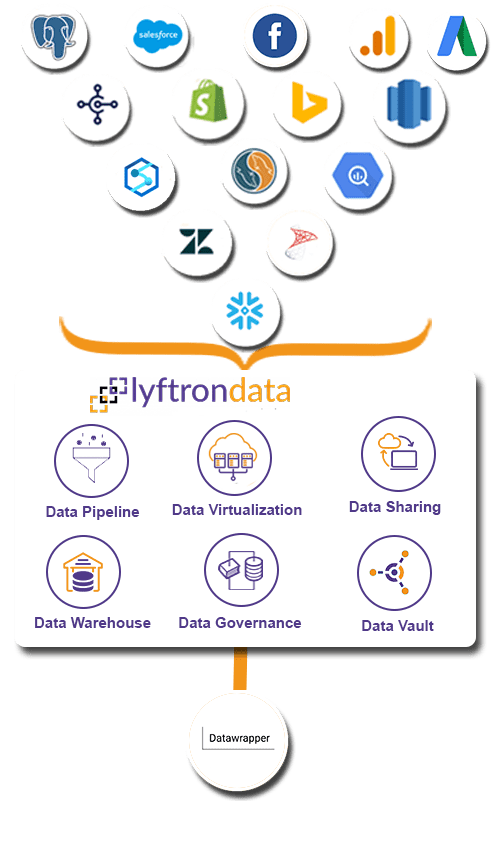
Create connections
between data
sources and Data Wrapper

Prepare a source to the Data Wrapper pipeline by selecting tables in bulk

Assemble a workflow and schedule it to start the Data Wrapper migration process

Share your data
with third-party platforms
over API Hub
-

Simple and Intuitive
Switch to Data Wrapper like a boss.
-

High Performance
Enjoy Data Wrapper high performance with codeless data environment.
-

Prebuilt Transformation
Say goodbye to tedious manual tasks with prebuilt transformation templates
-

Monitoring Data
Monitor your Data Wrapper data frequently.
Integrate data from ERP, CRM, legacy databases, and other 300+ sources
Hear how Lyftrondata helped accelerate the data
journey of MOL Group
reporting
onboarded
reduction
sales
 Lyftrondata enables instant analytics on WNI weather data that helped us streamline shipping lines.

Koichi Tsuji
Consulting Partner at MOL Group
FAQs
What is Data Wrapper?
Datawrapper Integration is a tool we built to make it easy for journalists and other communicators to create simple charts, maps, and tables. To create a visualization, you paste in your numbers and choose a visualization type.
What are the features of Data Wrapper?
What are the shortcomings of Data Wrapper?
Limited flexibility: Datawrapper ETL has limited flexibility when working with visuals.
Diciffulty in customizing fonts: Some Datawrapper Integration users have a difficult time customizing fonts and colors.
Start modernizing your Data Wrapper journey today