4 Simple Steps for Migrating to
Fusion Charts with zero coding


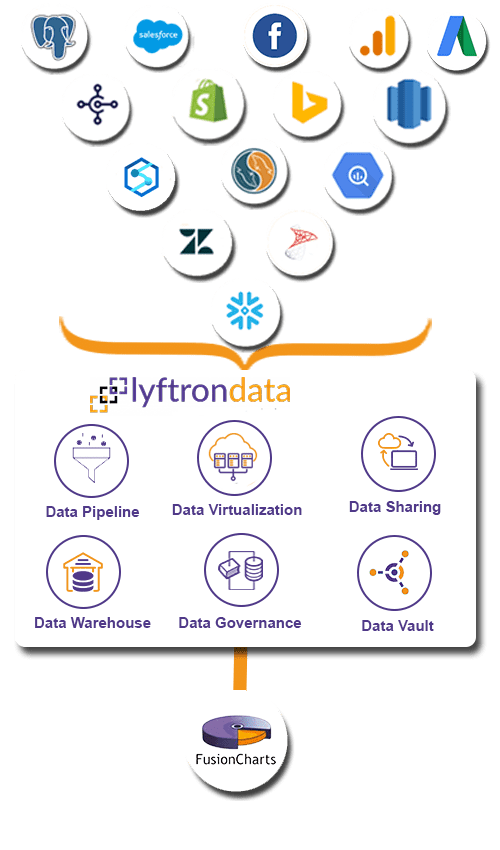
Create connections
between data
sources and Fusion Charts

Prepare a source to the Fusion Charts pipeline by selecting tables in bulk

Assemble a workflow and schedule it to start the Fusion Charts migration process

Share your data
with third-party platforms
over API Hub
-

Simple and Intuitive
Switch to Fusion Charts like a boss.
-

High Performance
Enjoy Fusion Charts high performance with codeless data environment.
-

Prebuilt Transformation
Say goodbye to tedious manual tasks with prebuilt transformation templates
-

Monitoring Data
Monitor your Fusion Charts data frequently.
Integrate data from ERP, CRM, legacy databases, and other 300+ sources
Hear how Lyftrondata helped accelerate the data
journey of MOL Group
reporting
onboarded
reduction
sales
 Lyftrondata enables instant analytics on WNI weather data that helped us streamline shipping lines.

Koichi Tsuji
Consulting Partner at MOL Group
FAQs
What is Fusion Charts?
FusionCharts Integration is a cloud-based JavaScript charting library tool that helps businesses gather all data from their cloud-based and on-premise applications and transform the data into interactive dashboards.
What are the features of Fusion Charts?
What are the shortcomings of Fusion Charts?
Complexity of development customization: FusionCharts Integration tool has the complexity of development customization issues.
Costly option: FusionCharts Connectors software is quite costly.
Doesn't work well: FusionCharts Drivers tool doesn't work well occasionally.
Start modernizing your Fusion Charts journey today