4 Simple Steps for Migrating to
Grafana with zero coding


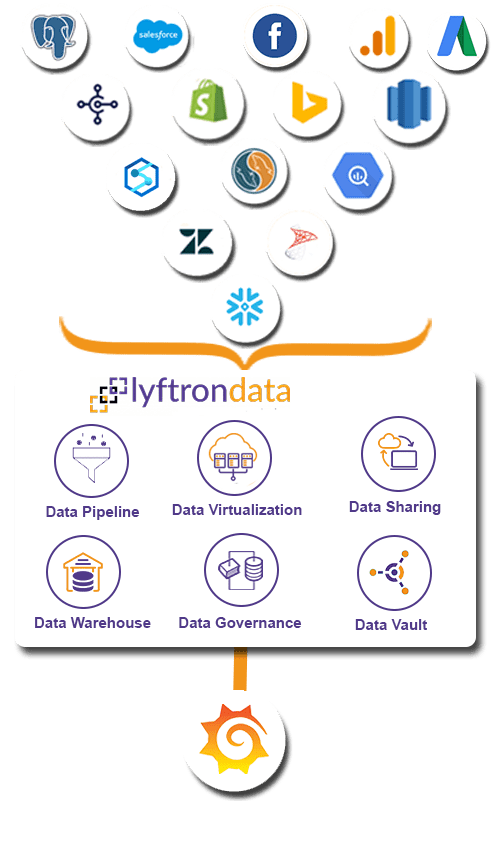
Create connections
between data
sources and Grafana

Prepare a source to the Grafana pipeline by selecting tables in bulk

Assemble a workflow and schedule it to start the Grafana migration process

Share your data
with third-party platforms
over API Hub
-

Simple and Intuitive
Switch to Grafana like a boss.
-

High Performance
Enjoy Grafana high performance with codeless data environment.
-

Prebuilt Transformation
Say goodbye to tedious manual tasks with prebuilt transformation templates
-

Monitoring Data
Monitor your Grafana data frequently.
Integrate data from ERP, CRM, legacy databases, and other 300+ sources
Hear how Lyftrondata helped accelerate the data
journey of MOL Group
reporting
onboarded
reduction
sales
 Lyftrondata enables instant analytics on WNI weather data that helped us streamline shipping lines.

Koichi Tsuji
Consulting Partner at MOL Group
FAQs
What is Grafana?
Grafana Integration is an interactive open-source data-visualization platform that enables users to view their data through charts and graphs that are combined into one dashboard (or multiple dashboards!) for simpler interpretation and understanding. Grafana Integration was created by Grafana Labs.
What are the features of Grafana?
What are the shortcomings of Grafana?
Limitations on dashboard organization and design: Grafana Connectors tool has limitations on dashboard organization and design.
Visualization panels are limited: Visualization panels are limited to those made available by Grafana ETL Labs and its community.
No data collection and storage: Grafana Integration has no data collection and storage.
Limited data type visualizations: Grafana Drivers has limited data type visualizations.
Start modernizing your Grafana journey today