4 Simple Steps for Migrating to
Plotly with zero coding


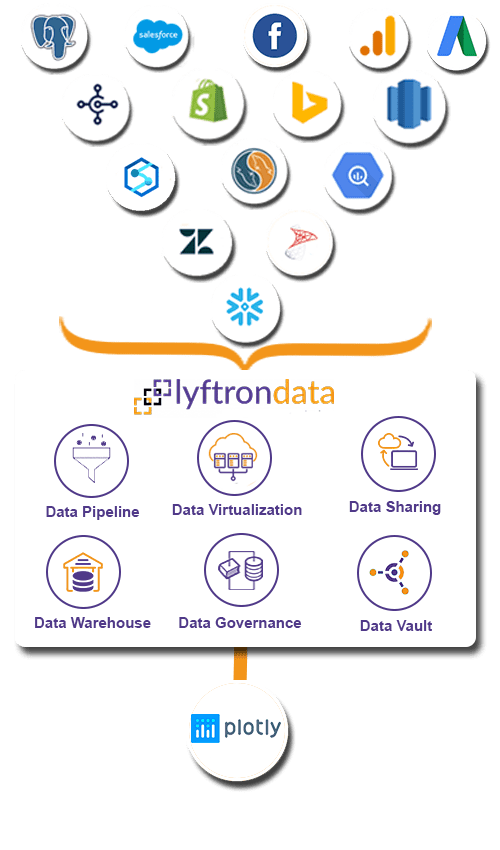
Create connections
between data
sources and Plotly

Prepare a source to the Plotly pipeline by selecting tables in bulk

Assemble a workflow and schedule it to start the Plotly migration process

Share your data
with third-party platforms
over API Hub
-

Simple and Intuitive
Switch to Plotly like a boss.
-

High Performance
Enjoy Plotly high performance with codeless data environment.
-

Prebuilt Transformation
Say goodbye to tedious manual tasks with prebuilt transformation templates
-

Monitoring Data
Monitor your Plotly data frequently.
Integrate data from ERP, CRM, legacy databases, and other 300+ sources
Hear how Lyftrondata helped accelerate the data
journey of MOL Group
reporting
onboarded
reduction
sales
 Lyftrondata enables instant analytics on WNI weather data that helped us streamline shipping lines.

Koichi Tsuji
Consulting Partner at MOL Group
FAQs
What is Plotly?
Plotly Integration provides online graphing, analytics, and statistics tools for individuals and collaboration, as well as scientific graphing libraries for Python, R, MATLAB, Perl, Julia, Arduino, and REST.
What are the features of Plotly?
What are the shortcomings of Plotly?
The number of color palettes is limited: Plotly Connectors tool has a limited number of colors available.
Lack of customer support: Plotly Integration has limited customer support services.
Sometimes fails to visualize extremely large datasets: Plotly ETL tool often fails to visualize extremely large datasets.
Start modernizing your Plotly journey today